If you work in digital marketing, you’ve probably come across the term “identity graph” or “ID graph” in conversations about data or identity. Yet, the technology is often under-explained or glossed over as it’s generally not consumer-facing. This is unfortunate, as identity graphs are foundational to most (if not all) audience and personalisation use cases. As such, understanding what they are and how they work is essential for understanding related concepts and technologies in the data and identity space.
Like many concepts in martech and adtech, understanding how the technology works, why it’s important, and how to contextualise its role within an already complex landscape can be challenging. To help, we’ve written this guide, bringing together what we believe are the most important concepts, all in one place.
Here you’ll learn what identity graphs are, how they’re built, how they enable marketing use cases, where they show up in mar/adtech systems, what the “graph” in identity graph stands for, and the role of graph databases. We’ll also use plenty of visuals and diagrams to help illustrate these concepts.
As this guide focuses on explaining concepts rather than deep technical details, there will certainly be nuances that aren’t covered. That said, I believe that by the end, you’ll know more about identity graphs than 95% of your peers. Not only that, you’ll have a solid conceptual chassis on top of which more knowledge can be added.
To skip directly to a specific section, please use the following links:
Estimated reading time: 18 minutes
Ready? Great, let’s begin.
What are Identity Graphs?
An Identity Graph (or ID Graph) is a database that collects and links all data points related to a single user.
They’re used to create and store unified customer profiles (or what’s often referred to as “single customer views”) to enable and augment audience and personalisation-based marketing use cases.
How are Identity Graphs created?
There are five main steps that go into building and maintaining an identity graph (Figure A).

Figure A – Steps for building and maintaining an identity graph
1. DATA INGESTION – Collecting and incorporating data from high value and relevant sources
2. DATA NORMALISATION – Cleaning and standardising the ingested data
3. IDENTITY RESOLUTION – Matching data points from different sources to create a unified view of a user
4. GRAPH CREATION – Constructing the graph itself
5. UPDATES AND OPTIMISATION – Ensuring the graph remains relevant, efficient and compliant over time
Data ingestion
The first step is collecting and ingesting data from high value and relevant sources. Data types can include PII (e.g. mail, user name, phone number), online IDs (e.g. 1st party cookies, universal IDs, web IDs), as well as behavioral, interest, and demographic data.
Data collection methods* include but are not limited to the following:
Direct collection – Gathering data directly from users through forms, subscriptions, and account creation processes.
Tracking technologies – Using cookies, device IDs, universal IDs and similar technologies to track user behavior on websites and apps.
SDKs and APIs – Integrating SDKs in apps and using APIs to collect data from various services and platforms.
Data partnerships – Forming partnerships and agreements with other businesses to share or exchange data.
Bidstream – Collecting information generated and shared during the programmatic RTB process.
*Data collection methods can sometimes overlap
As you’d expect, the data collection stage is crucial for building a comprehensive identity graph as the quality and breadth of data directly impacts its effectiveness in identity resolution and personalisation efforts. Needless to say, it’s critical to ensure that data collection practices follow privacy regulations while also respecting user consent.
Data normalisation
Data Normalisation involves cleaning and standardising collected or ingested data to ensure consistency and integrity across various data types and sources. This step is essential because we gather data from different formats and sources (as mentioned earlier), making it necessary to prepare the data for further processing and analysis. The process typically includes the following steps (Figure B):
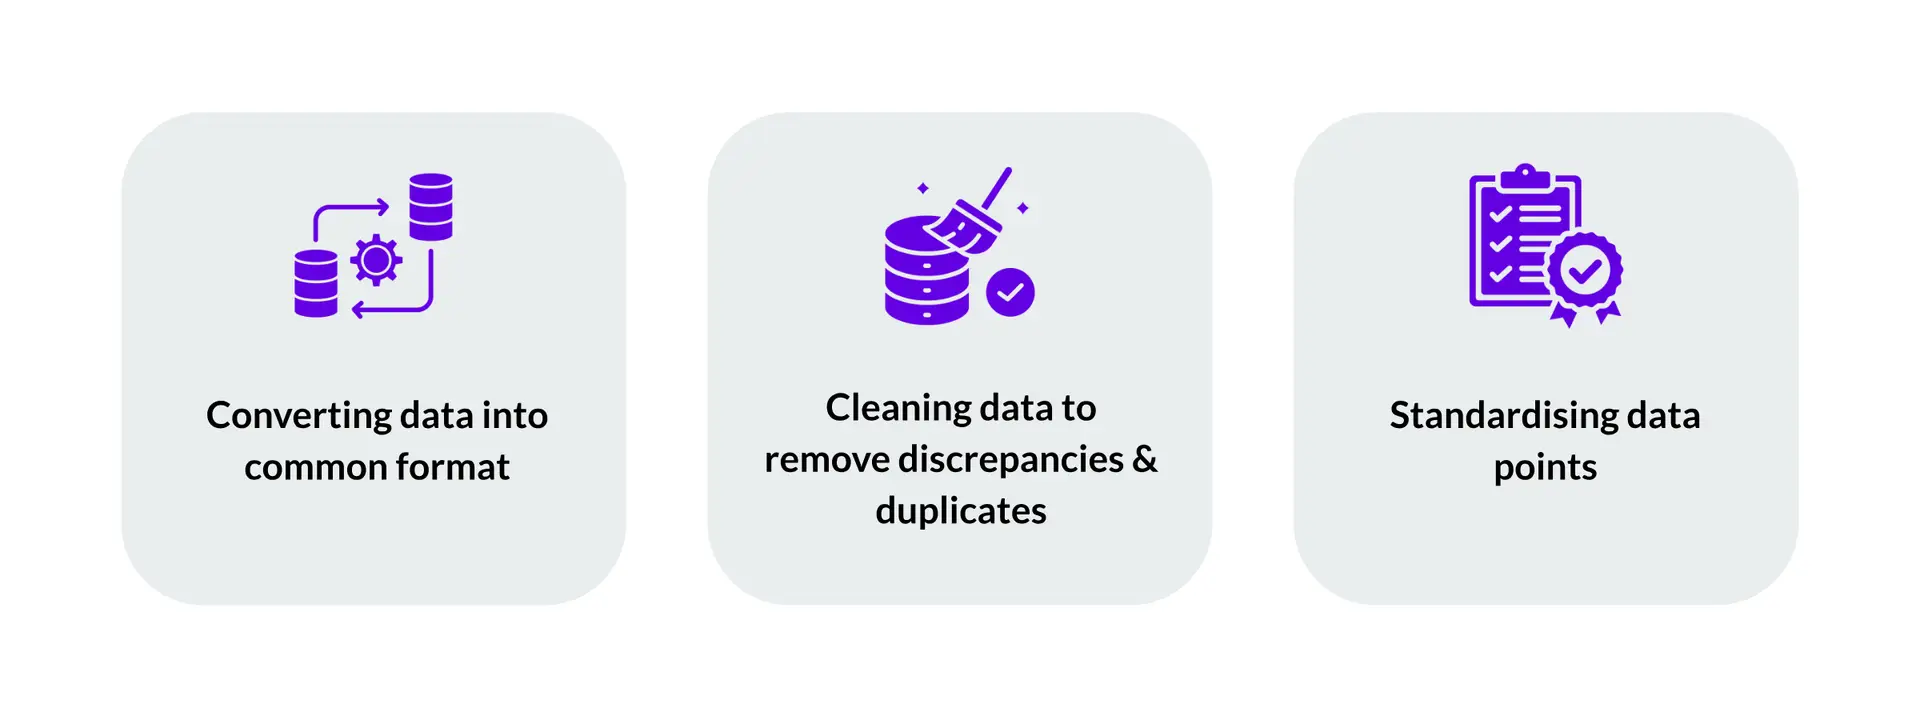
Figure B – Data normalisation steps
Identity resolution
Identity resolution is the process of matching data points from various sources to create a unified view of an individual.
Simply put, identity resolution means linking different pieces of data to a unique individual. When these data points are successfully matched to create a cohesive profile, that identity is considered “resolved”.
Note that the process can be extended beyond individuals to other entities like households. Identity resolution is one of the more common terms that come up when discussing identity-based technologies. Thus, it’s important to understand the concept as it underpins most (if not all) audience targeting and personalisation use cases.
Figure C represents an abstracted before and after view of the identity resolution process.
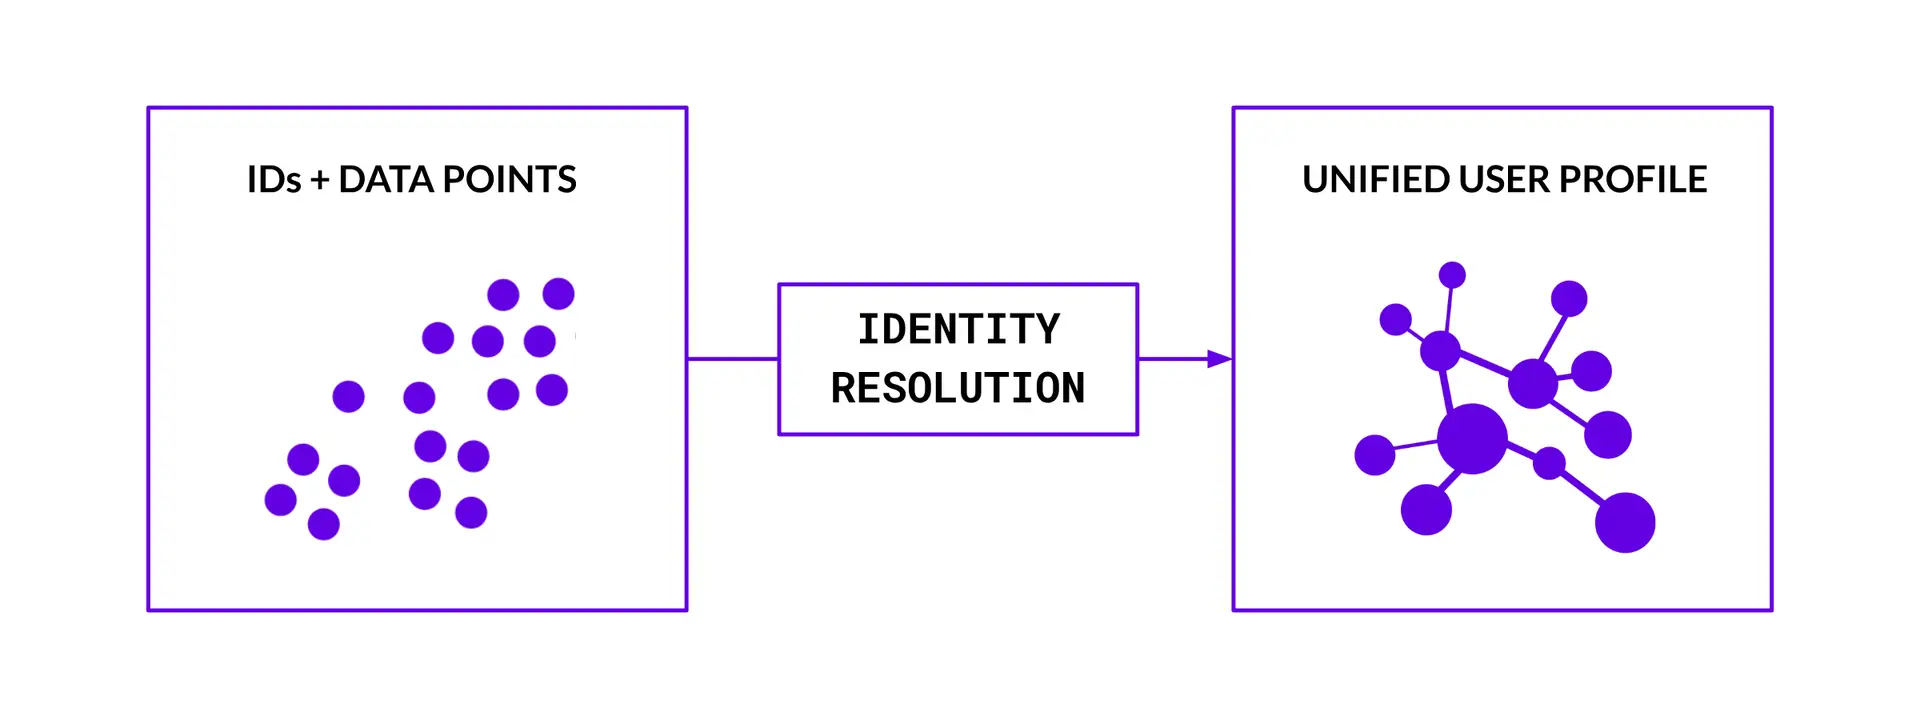
Figure C – Identity resolution
In the before, we have a collection of ingested, normalised IDs and data points. In the after, we have a collection of “resolved” identities (or unified user profiles) that will go on to form the identity graph. To help visualise, picture a “multiple hub and spoke” model:
Hubs – Each hub represents a core piece of identifying information related to a given user (e.g. email address, phone number, device ID). These hubs are central nodes that connect to various spokes. As individuals often have multiple identifiers (e.g. email addresses, phone numbers, devices), these hubs aren’t isolated. They’re linked together to form a holistic view of the individual’s identity across the digital and physical world.
Spokes – Spokes represent different supporting data points connecting back to each hub. These can be other identifiers, or behavioural, interest and demographic data.
As you’d expect, identity graphs aren’t static. They’re dynamic with new spokes being added as users interact with different platforms and devices. The hubs are also constantly updated and interconnected as more data becomes available, reflecting the evolving nature of a user’s identity.
There are two categories of matching that comprise the identity resolution process (Figure D):
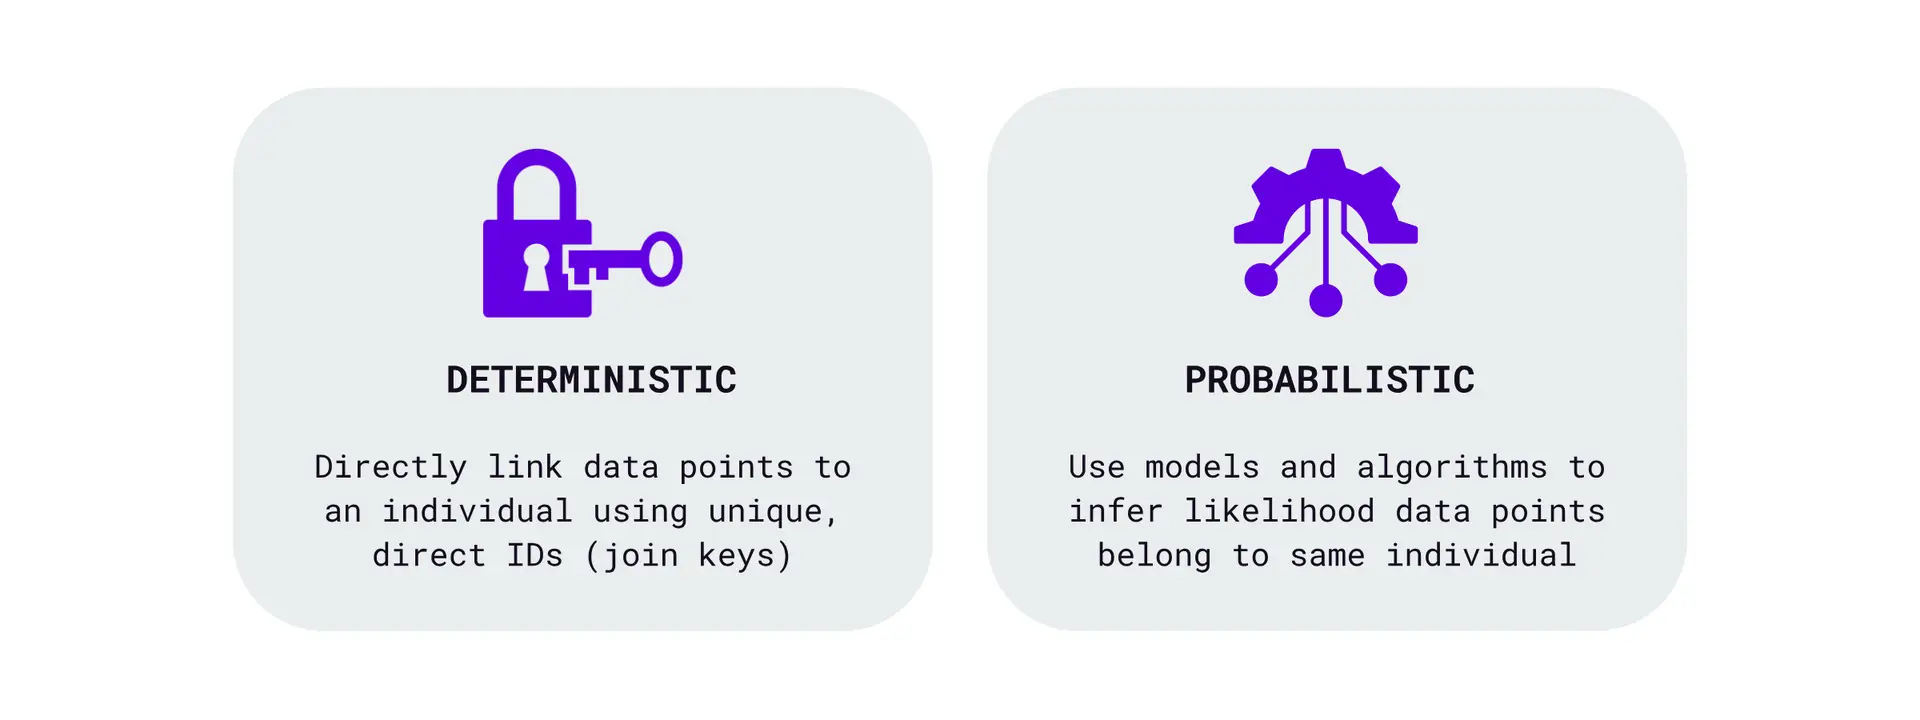
Figure D – Identity matching methodology types
DETERMINISTIC MATCHING
- Uses exact identifiers to link data points to individual users with certainty. Exact identifiers are common IDs (or a set of common IDs) called join keys or match keys. The ID type can vary depending on the context and data sources involved.
- Provides a high level of confidence in the accuracy of the matches as it relies on unique and verifiable data.
- Effectively forms the foundation of an identity graph, or what’s also referred to as an identity graph’s “data spine”.
PROBABILISTIC MATCHING
- Uses statistical algorithms to infer the likelihood that different data points belong to the same individual based on patterns, behaviours, and non-unique identifiers (e.g. IP addresses, device types, browsers, operating systems).
- Complements deterministic matching by filling in gaps and extending the reach of identity resolution where deterministic data might be sparse or fragmented.
- Like any algorithm, performance improves as more data is collected, refining the accuracy of inferred matches through continuous analysis.
The two methodologies are complementary and generally deployed in tandem. This provides the following benefits:
Comprehensive profiles – Deterministic matching provides a solid core of linked identifiers while probabilistic matching adds layers of inferred connections, resulting in more complete user profiles.
Increased match rates – Combining methods lets identity graphs achieve higher match rates than using either method alone as probabilistic matching can link records that deterministic matching might miss.
Balancing scale and accuracy – Deterministic matching ensures accuracy where possible while probabilistic matching provides scale, allowing marketers to reach larger segments of their audience with a reasonable degree of confidence.
Continuous improvement – As new deterministic data becomes available, it can validate and strengthen the probabilistic inferences, leading to an ever-improving identity graph.
It’s important to note that certain probabilistic matching methods (ex: device fingerprinting) are facing increased scrutiny due to evolving user data privacy standards. The distinction between acceptable and questionable probabilistic techniques is a grey area in the industry, with shifting goalposts depending on incentives and who you ask, so definitely something to keep in mind.
Graph creation
After identity resolution, the next step is to construct the identity graph itself. This involves organising the linked identifiers into a graph structure where nodes (hubs) represent individuals and edges (spokes) represent the connections between their various identifiers.
The steps in the process are listed sequentially here, but can often occur in parallel.
1. GRAPH CONSTRUCTION
a. Create nodes and associated identifiers
- Each node represents an individual or entity that has been resolved as unique.
- There are attributes or sometimes secondary nodes connected to the unique identity node. These represent different identifiers (e.g. email, device IDs, cookie IDs) that have been matched to the primary identity.
b. Construct edges connecting nodes
- Edges represent the link between an identity (or entity) and its identifiers.
- Edges can also demonstrate relationships between different unique identities (such as family connections or organisational relationships in a B2B context).
Note that there are no direct links between different individuals in an identity graph. In other words, each resolved identity (or individual user profile) and its associated data points are stored separately. That said, the graph structure allows for relationships between different identifiers within an individual profile to be represented.
2. DATA SOURCE INTEGRATION
Integrate different, relevant data streams into the graph to ensure continuous data flow.
3. GRAPH DATABASE SETUP
a. Select the appropriate graph database technology.
b. Set up the initial graph database structure.
4. TESTING AND QA
a. Perform tests to ensure the graph accurately reflects data relationships.
b. Validate graph integrity against known data sets.
5. PRIVACY AND SECURITY MEASURES
a. Establish protocols for data privacy, including anonymisation and access controls.
b. Implement security measures to protect data within the graph.
6. GRAPH ACTIVATION
a. Integrate the graph with marketing and advertising platforms.
b. Make the graph accessible for querying and insight generation.
7. DOCUMENTATION AND TRAINING
a. Document graph structure and processes for internal use.
b. Train relevant teams on how to use, maintain, and extract data from the graph.
Updates and optimisation
If the graph creation step generates the graph, the updates and optimisation phase ensures its continued relevance and efficiency. Regular updates keep the graph accurate and functional while also ensuring adherence to evolving privacy & security standards. This process essentially repeats the steps of identity graph construction, but with new data.
1. (NEW) DATA INGESTION – Gather new data from different sources while automating ingestion to facilitate real-time updates.
2. DATA NORMALISATION – Check new data for veracity and cleanliness to correct for discrepancies and ensure consistency.
3. IDENTITY RESOLUTION UPDATES – Apply identity resolution to new data, update profiles with new identifiers, and remove/revise outdated information.
4. DATABASE UPDATES – Add new nodes and edges for new identifiers and relationships while removing nodes and edges that are no longer relevant.
5. MODEL OPTIMISATION – Fine-tune and improve probabilistic identity resolution algorithms based on new data patterns and insights.
6. PRIVACY COMPLIANCE CHECKS – Regularly review and update data handling practices to ensure compliance with evolving regulations.
How Identity Graphs enable marketing use cases
Identity Graphs enable marketing use cases primarily through identity resolution.
Yes, not only is identity resolution essential for building identity graphs, it also acts as the key mechanism through which identity graphs support marketing use cases across other platforms. It helps to think of this dynamic as a circular relationship between identity graphs and identity resolution (Figure E).
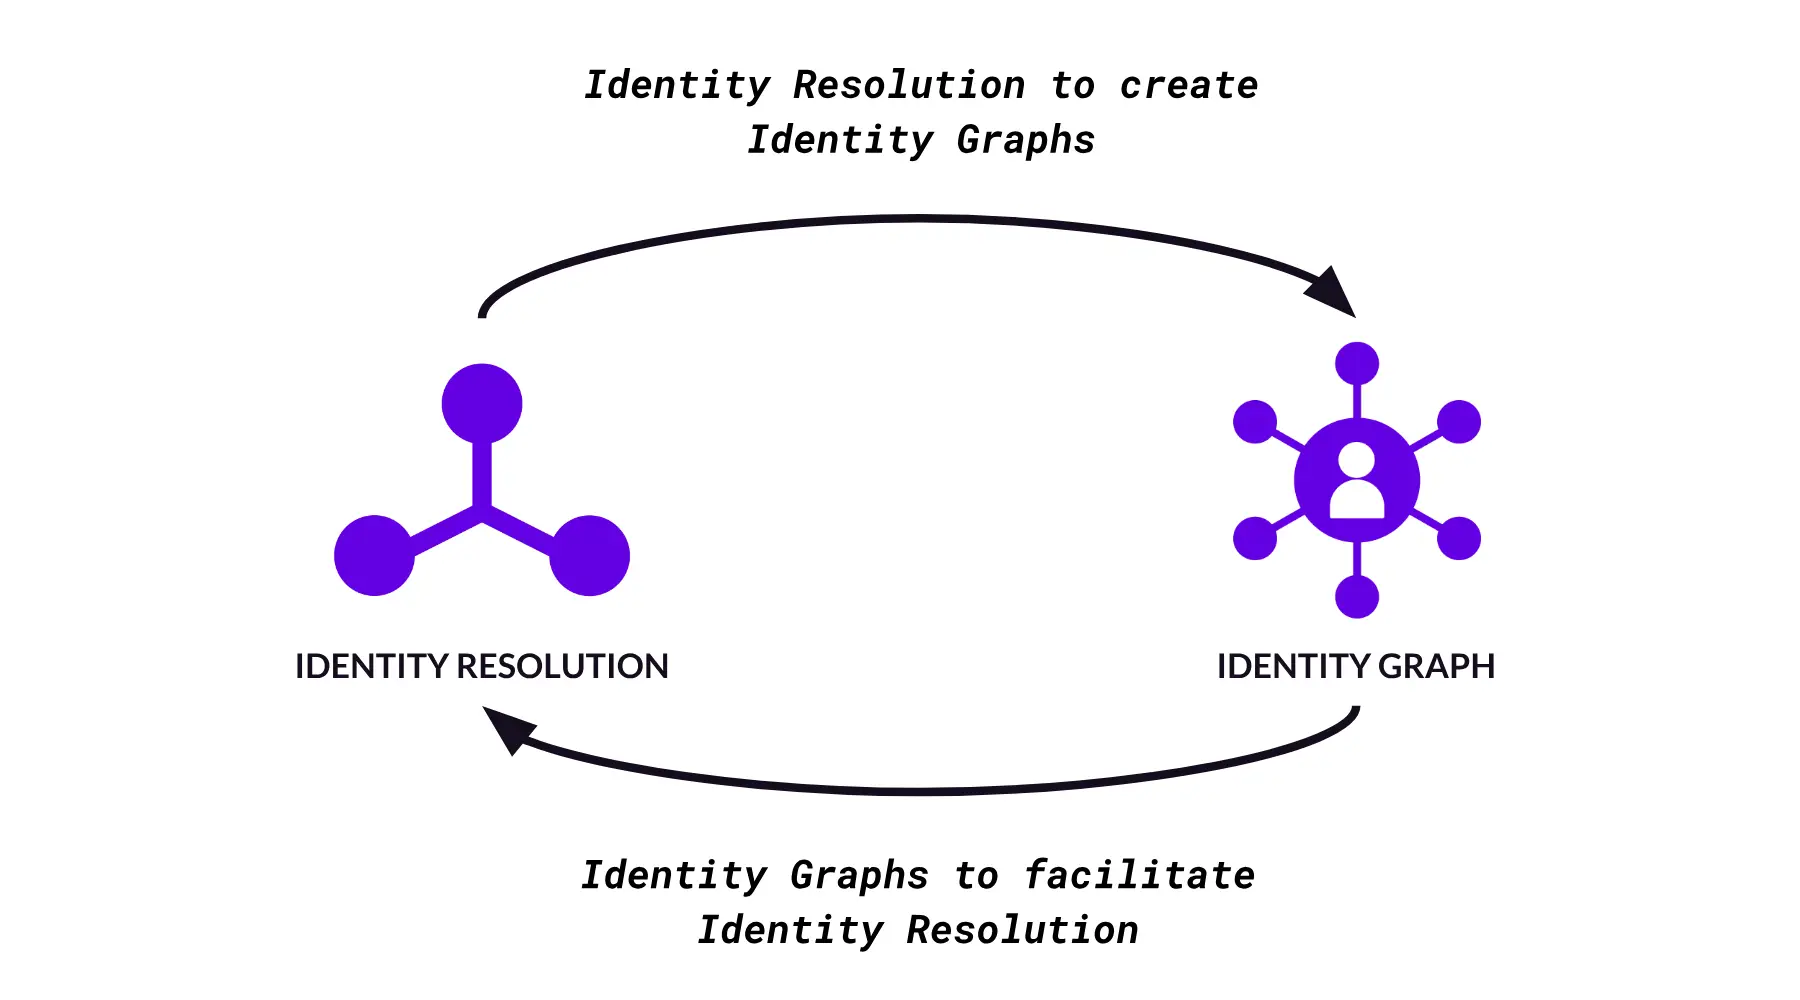
Figure E – Identity Resolution <-> Identity Graph
Here’s how it works:
1. [From left to right] Identity resolution to create identity graph – Identity resolution techniques are applied to disparate data sources to match and link identifiers to individuals. This process results in the creation of an identity graph.
2. [From right to left] Identity graphs to facilitate identity resolution – After the identity graph is created, it serves as a foundational database that can be queried and updated as new data is added. This allows the graph itself to become a tool to facilitate ongoing identity resolution both within itself and for other martech and adtech platforms.
In essence, identity resolution is both a key step in building an identity graph as well as a capability that the graph then facilitates and enhances. But how does that enable marketing use cases?
Identity Graphs use identity resolution to enable marketing use cases by extending the utility of external datasets matched to the graph.
Figure F provides a conceptual illustration of how an identity graph facilitates use cases using uploaded customer data sets.
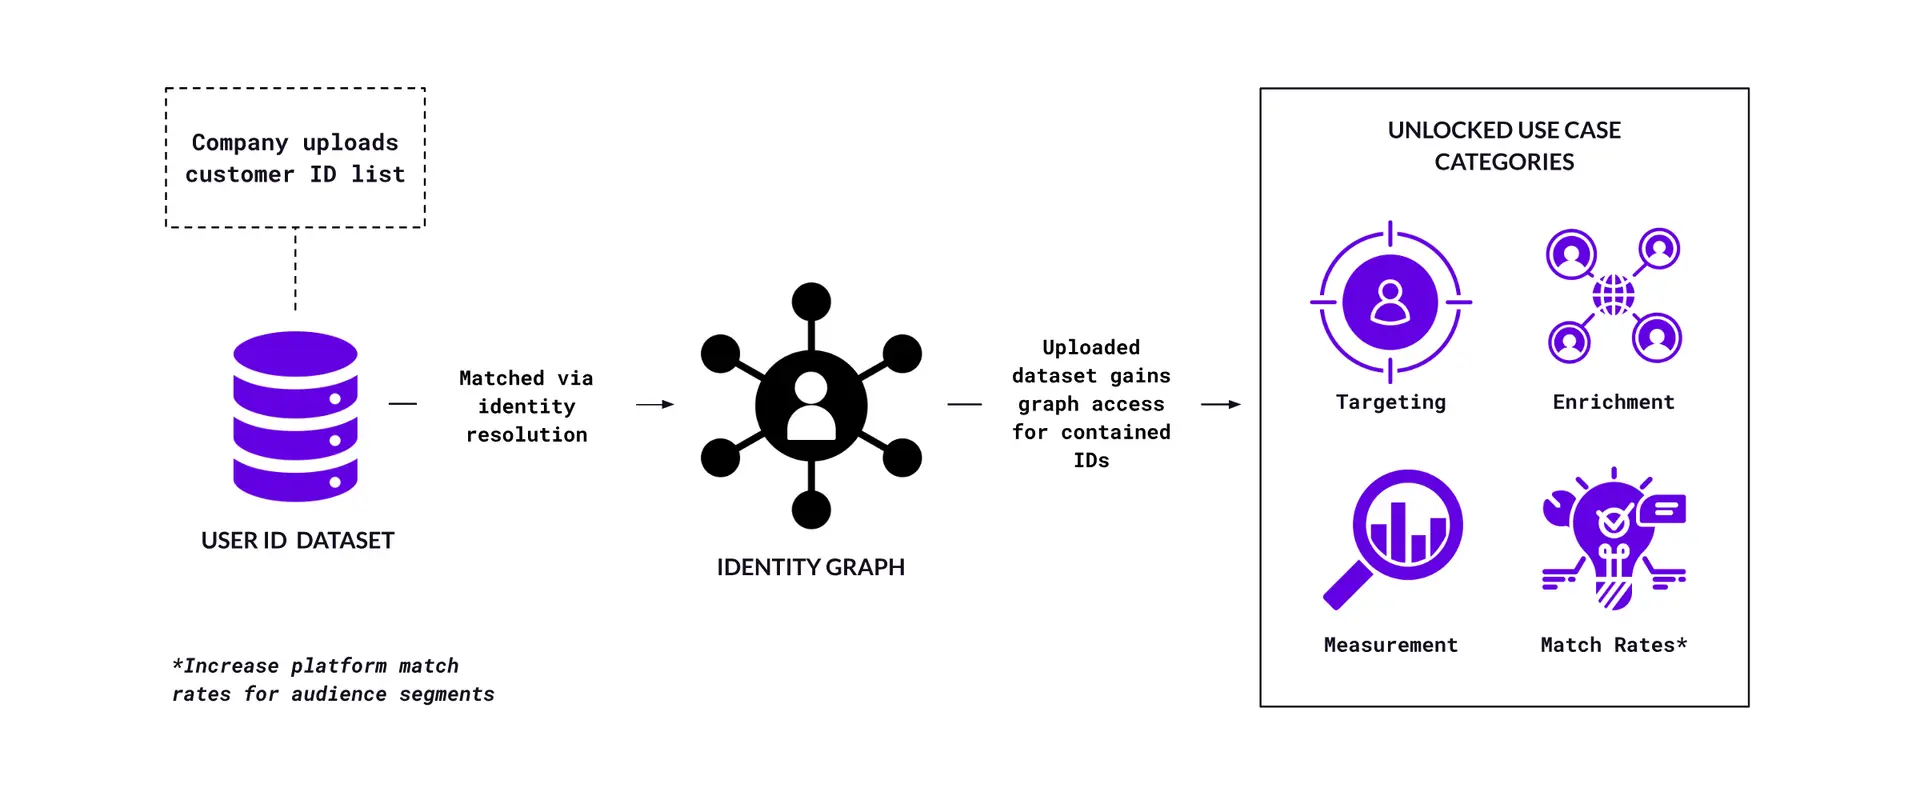
Figure F – Identity graph use case enablement process
Walking through the process step by step:
1. A company uploads a list of customer IDs (e.g. hashed emails, device IDs) from a data repository (e.g. CRM, CDP, analytics) to a mar/adtech platform.
2. The uploaded customer IDs are matched (via identity resolution) to a set of corresponding identifiers belonging to existing profiles on the graph within the mar/adtech platform. This mechanic is also referred to as ID crosswalking (ie. “walking” from one ID set to another).
3. From there, the company can identify those customers across more channels and devices. Not only that, but additional data points about their customers (e.g. online interactions, behavioural signals, interests) become available.
4. This unlocks a variety of marketing use cases for the company that uploaded the initial list of customer IDs.
So when you hear of martech and adtech platforms having different audience and personalisation capabilities, in most cases, this process is how identity graphs make it possible. Next, let’s explore a few of the more common use case categories.
Audience targeting or exclusion
Here, we’re matching uploaded IDs to existing resolved user profiles in the graph. Since the graph recognises the different channels and devices a given individual uses, we can now address or suppress those individuals across these different environments within a campaign.
Unlocked use case examples
- On-platform audience targeting
- Cross-environment targeting & exclusion
- Cross environment frequency capping
Data enrichment
Enrichment refers to the process of attaching additional data points to an original dataset. As mentioned earlier, identity graphs can reveal users’ digital interactions, behaviors, and interests. These extra data points enrich the initial user dataset, opening the door for a range of use cases.
Unlocked use case examples
- Insight generation
- Audience discovery
- Audience expansion/modeling
- Audience segmentation
Measurement and attribution
Since identity graphs can contain digital touchpoints like search queries, product page views, ad clicks, and purchases, they allow brands to better analyse end-to-end customer behavior. This in turn, allows more accurate and comprehensive measurement and attribution by linking interactions across different environments to a single user.
Unlocked use case examples
- Multi-touch attribution
- Cross-channel attribution
- Customer journey analysis
- Lifetime value calculation
Match rate improvement
By enabling ID crosswalks (ie. matching one ID set to another), identity graphs expand the “match surface area” of uploaded data sets. This improves match rates for media activation platforms, CDPs, data clean rooms and even universal IDs. Think of this way: identity resolution unifies and organises user data, while improved match rates reflect the quality and success of that process.
Unlocked use case examples
- Improve match rates for media activation platforms
- Improve match rates for CDPs and Data Clean Rooms
- Extend utility of universal IDs
Where Identity Graphs show up (kind of everywhere)
Now that we know how identity graphs are used and what they’re used for, we can better contextualise where they appear.
Identity Graphs are a core feature of most martech and adtech platforms and all technologies with identity and audience capabilities.
Figure G outlines several industry technologies that utilise identity graphs, along with examples of the functions they enable and/or enhance.
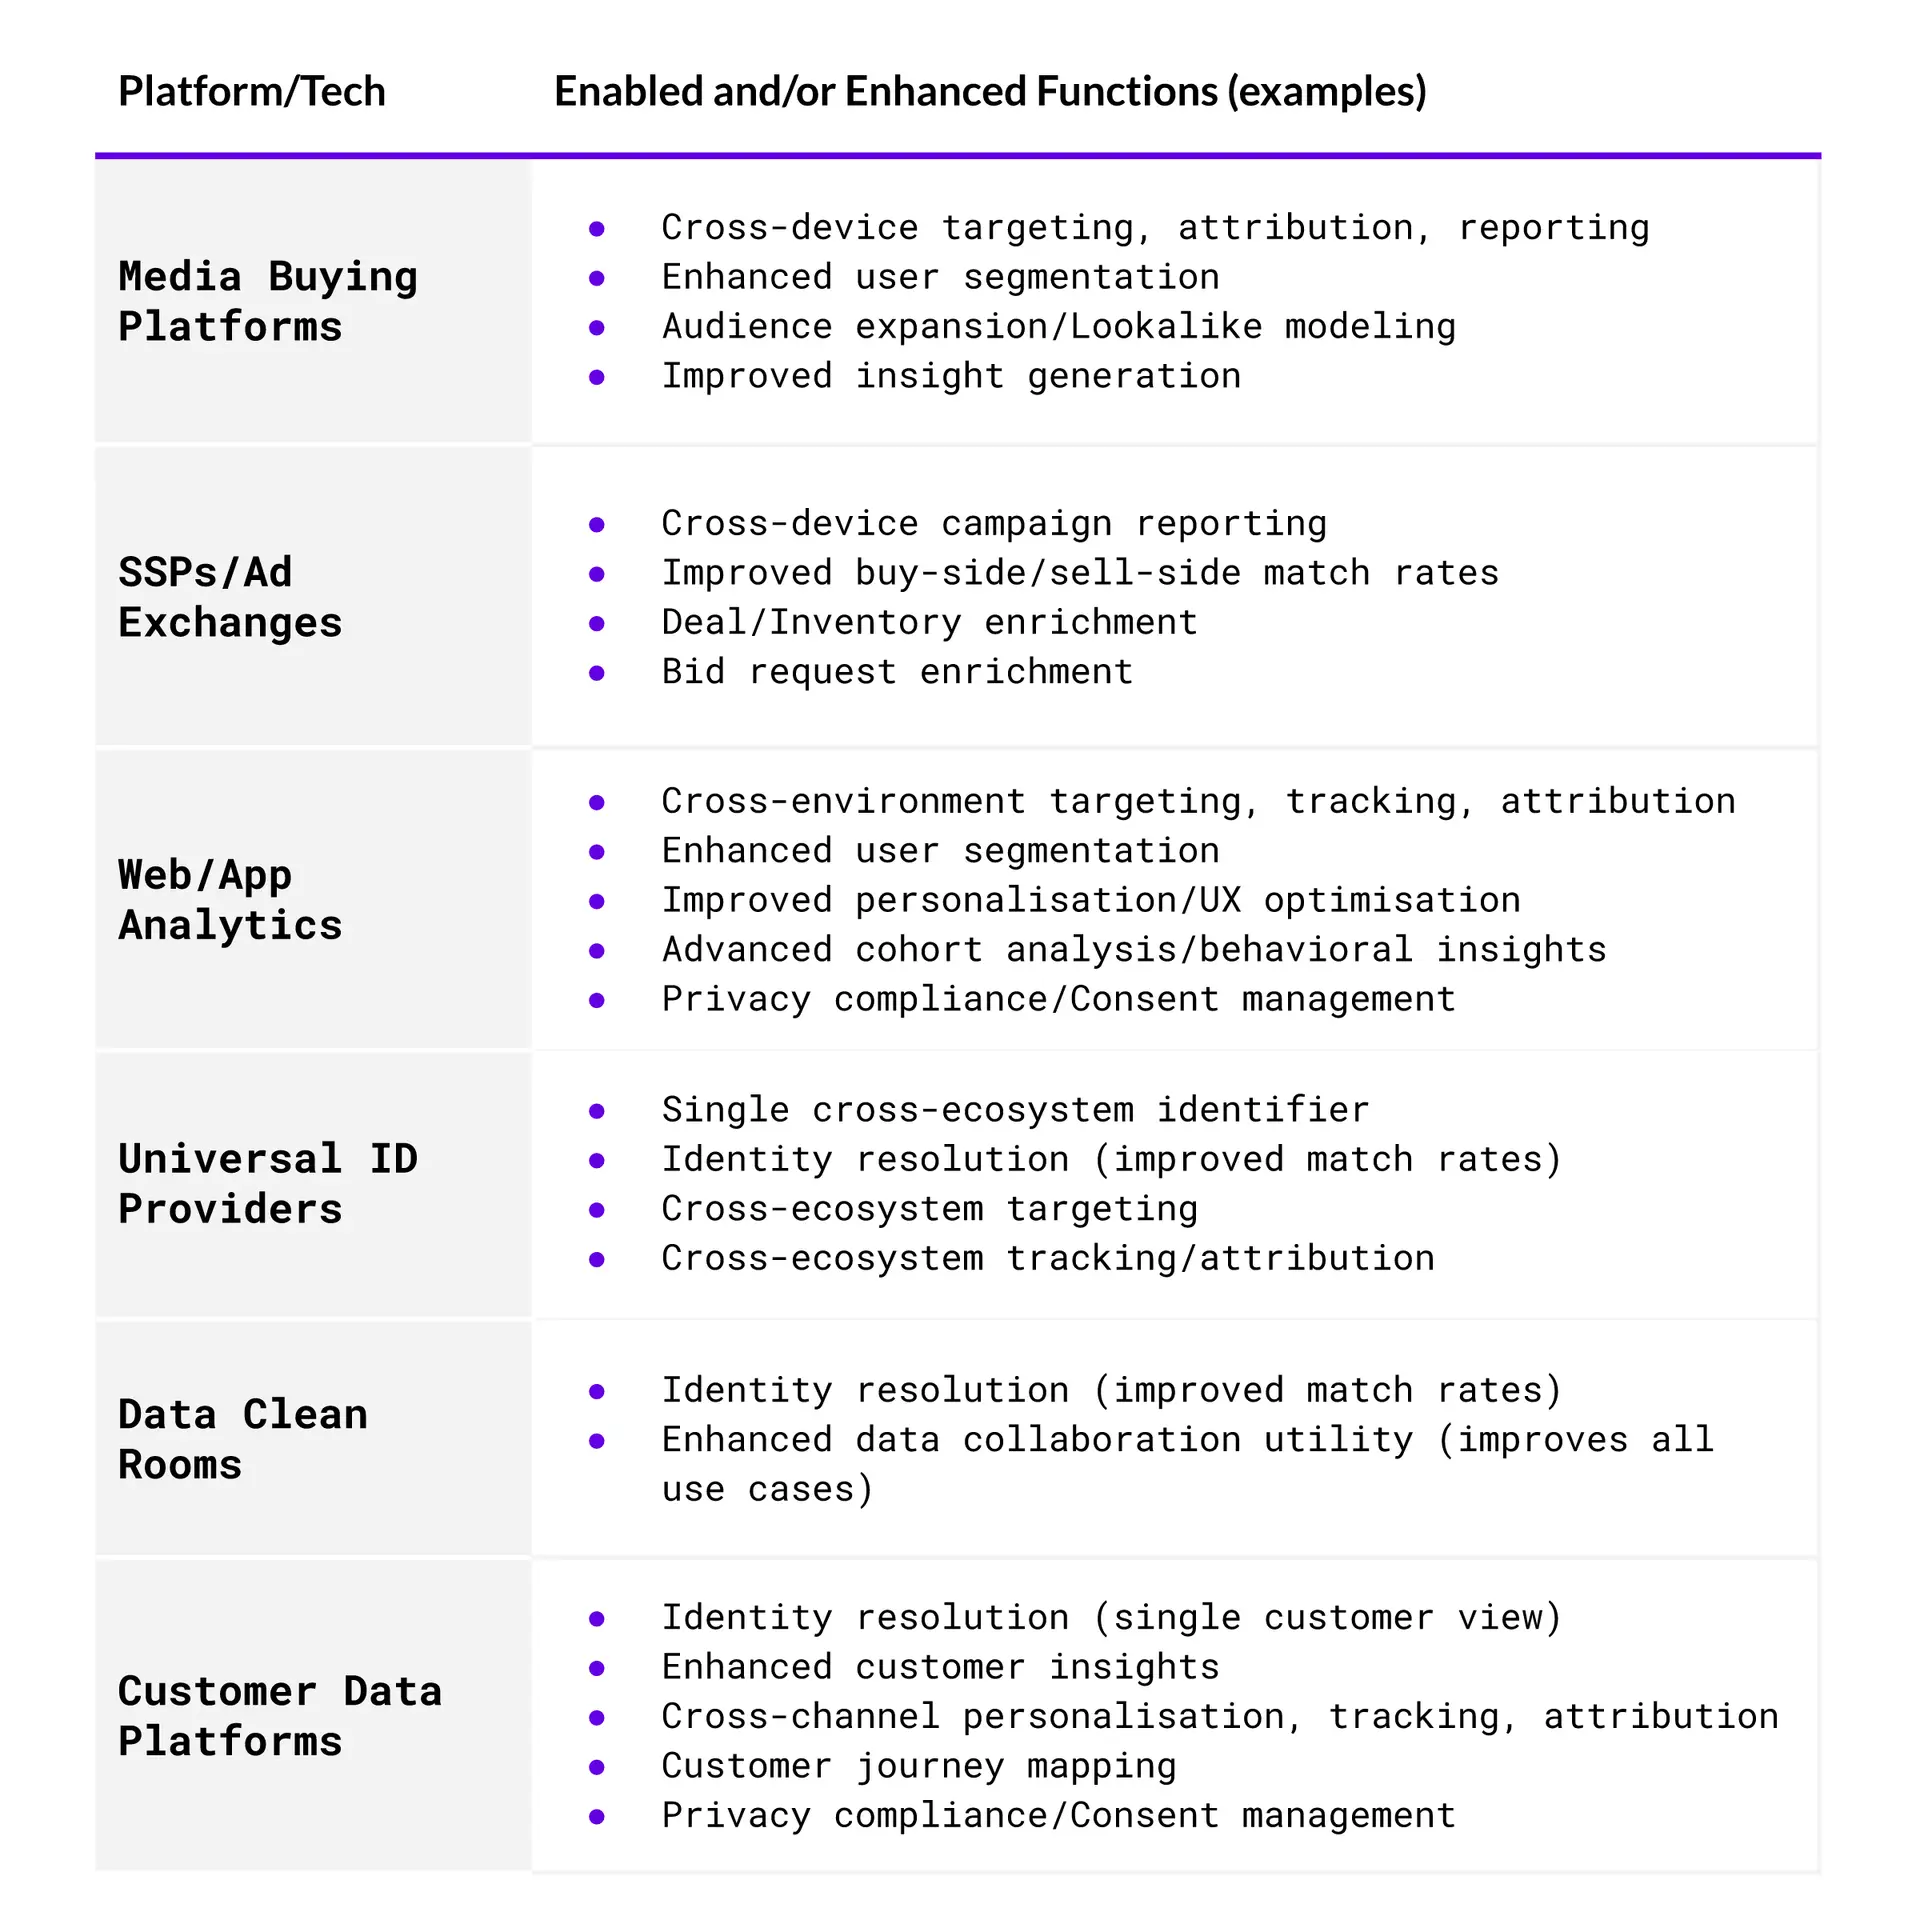
Figure G – Industry tech and use cases
Most platforms, walled gardens, data vendors and ID providers maintain their own identity graphs. In fact, walled gardens like Google and Meta probably have the largest, most comprehensive identity graphs in the world. Think about how much data they have on individuals, all linked to an email or some sort of deterministic login. This is a big reason their advertising products are so powerful.
Platforms with identity resolution and data matching capabilities such as customer data platforms (CDPs) and data clean rooms (DCRs) often integrate multiple identity graphs. This boosts match rates and coverage, making their products more powerful and attractive to users.
What the "Graph" in Identity Graph stands for
If identity graphs are actually databases, why are they called “graphs”?
They’re called graphs because they apply the principles of “graph theory” to represent and manage data. Graph theory is a mathematics field where a graph is represented by a collection of nodes and edges (or connections) between those nodes. Applied to identity graphs, nodes represent data points associated with an individual user, and edges represent the relationships between those data points (Figure H).
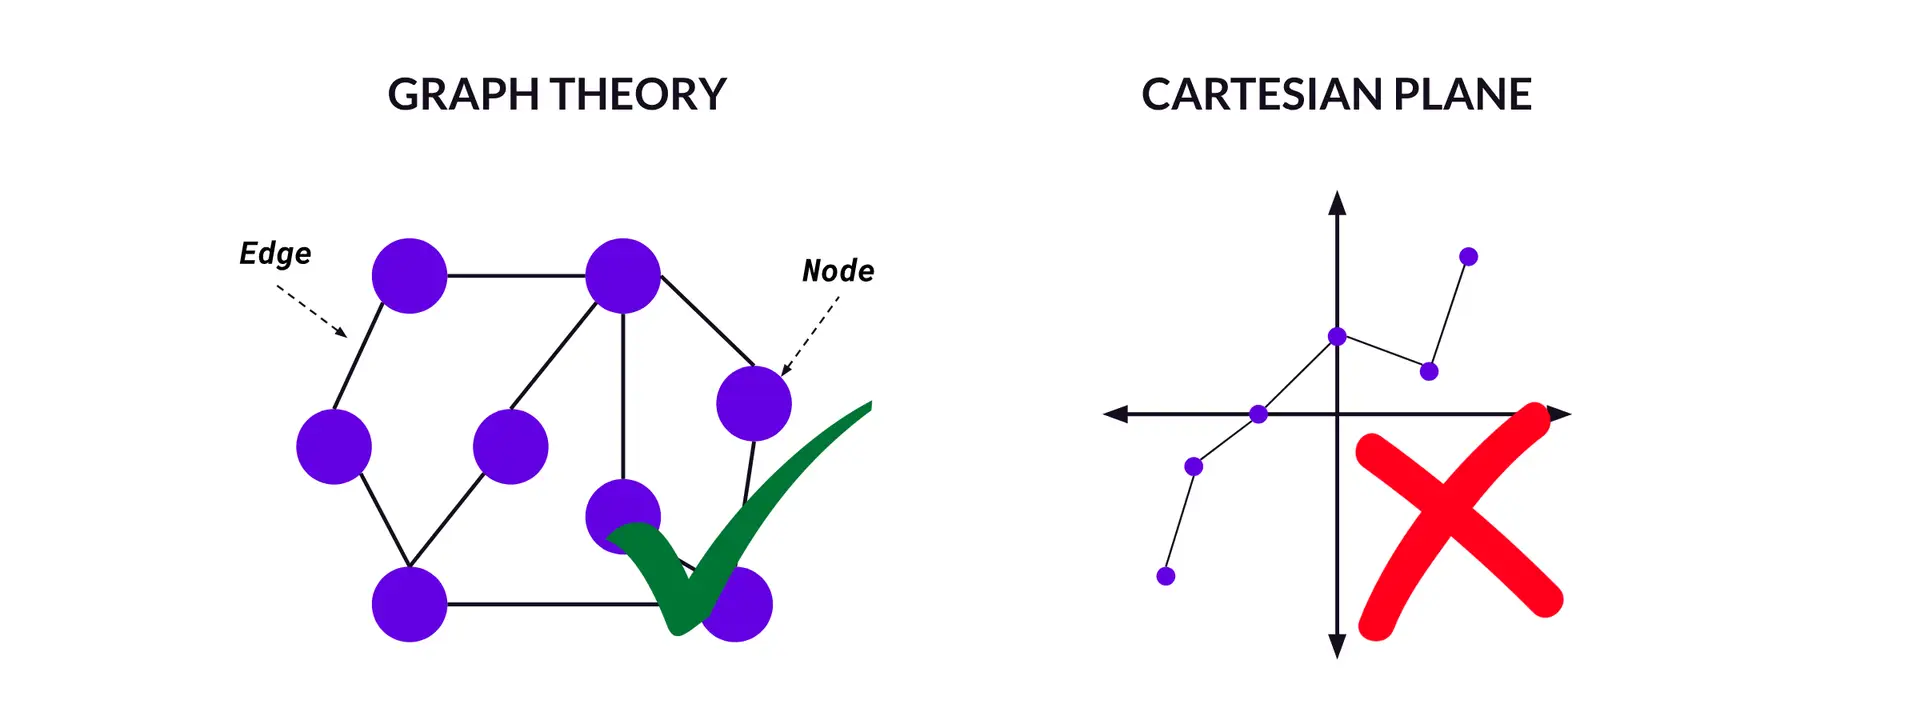
Figure H – Graph Theory vs. Cartesian Plane
The “graph” in identity graph refers to the conceptual model of representing and managing data, where entities are connected based on their relationships (like in a social network graph). In this context, graphs are not the typical two-dimensional graphs plotted on an x/y axis (Cartesian plane). Note that this model applies as long as connections between entities (e.g. users and their devices or accounts) are being mapped, even if the data isn’t stored in a graph database.
The role of Graph Databases
Traditionally, identity graph solutions were built using relational (ie. SQL), NoSQL, or hybrid database approaches. However, as the complexity of relationships between identities and their attributes have grown – and the demand for real-time processing has increased – graph databases are increasingly becoming the preferred choice for building identity graphs.
Graph databases are designed to efficiently manage and query highly connected data in real-time. This makes them more suitable than traditional SQL or NoSQL databases for the specific demands of identity graphs, where complex relationships need to be traversed quickly and at scale.
Given their advantages, let’s take a closer look at graph databases, which are available as both enterprise and open source solutions. Some of the more prominent providers are highlighted in Figure I.
Figure I – Simplified identity graph schema
An example of a simplified Identity Graph schema
Figure J outlines an example of a highly simplified identity graph schema designed for a graph database. Here, we model entities as nodes and relationships as edges.
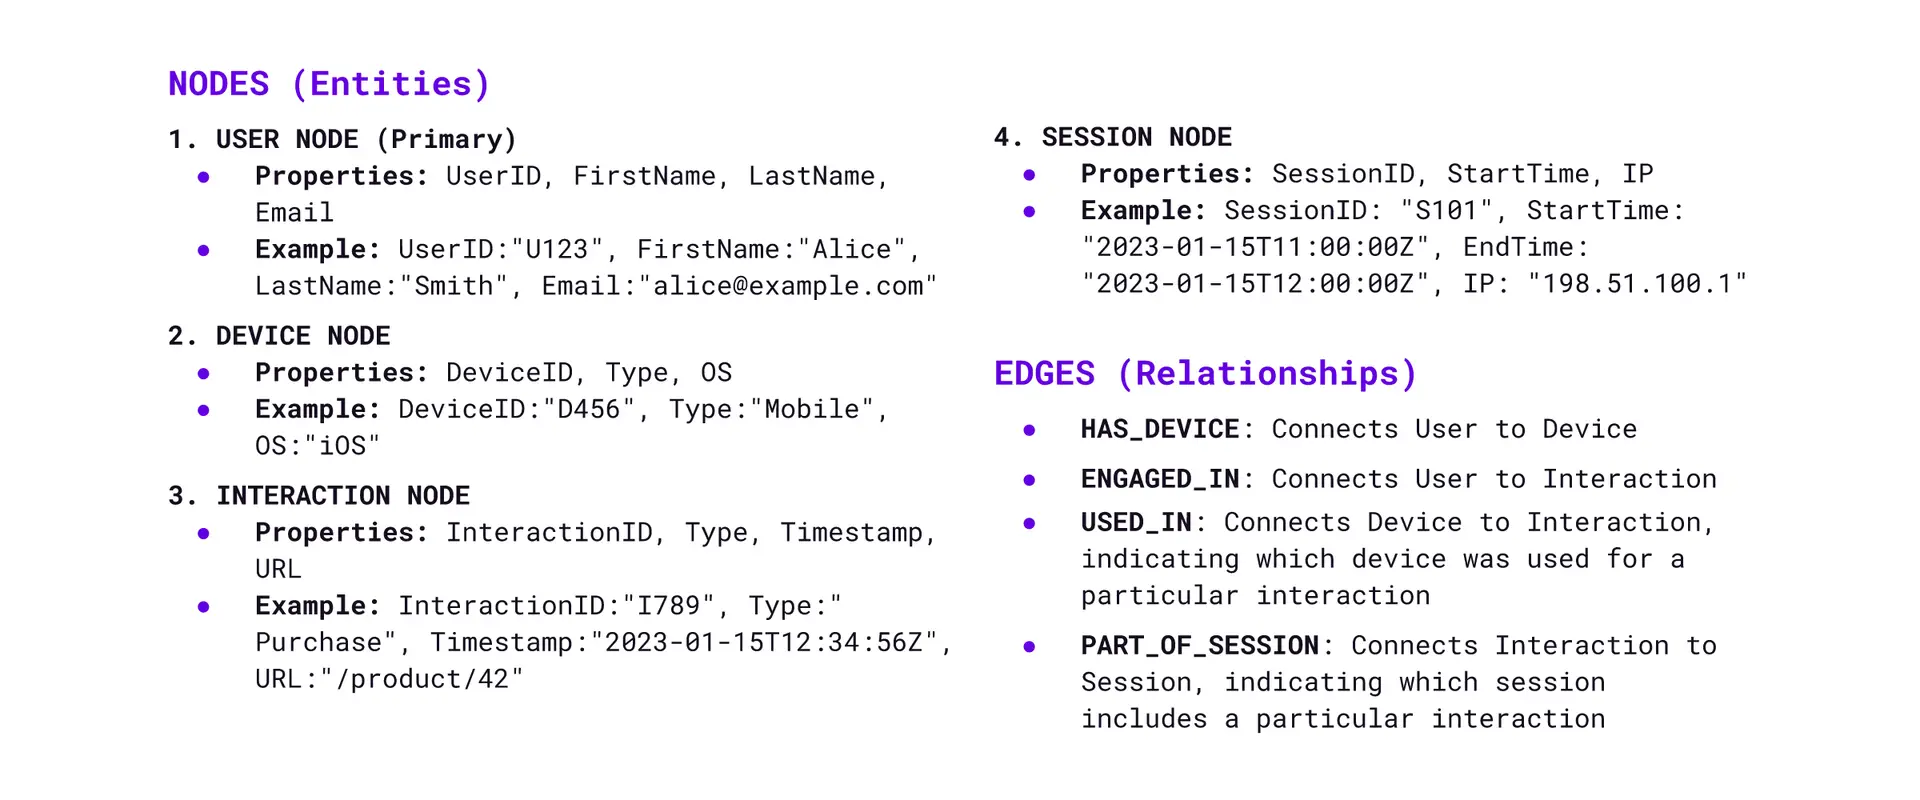
Figure J – Simplified identity graph schema
In this schema, the user nodes (primary) are connected to device nodes, interaction nodes, and session nodes through different types of relationships, providing a graph representation of users and their activities. The graph database allows one to easily traverse these relationships to gain insights into user behavior, device usage, and interactions with content or products.
Figure K represents this schema as a code snippet.
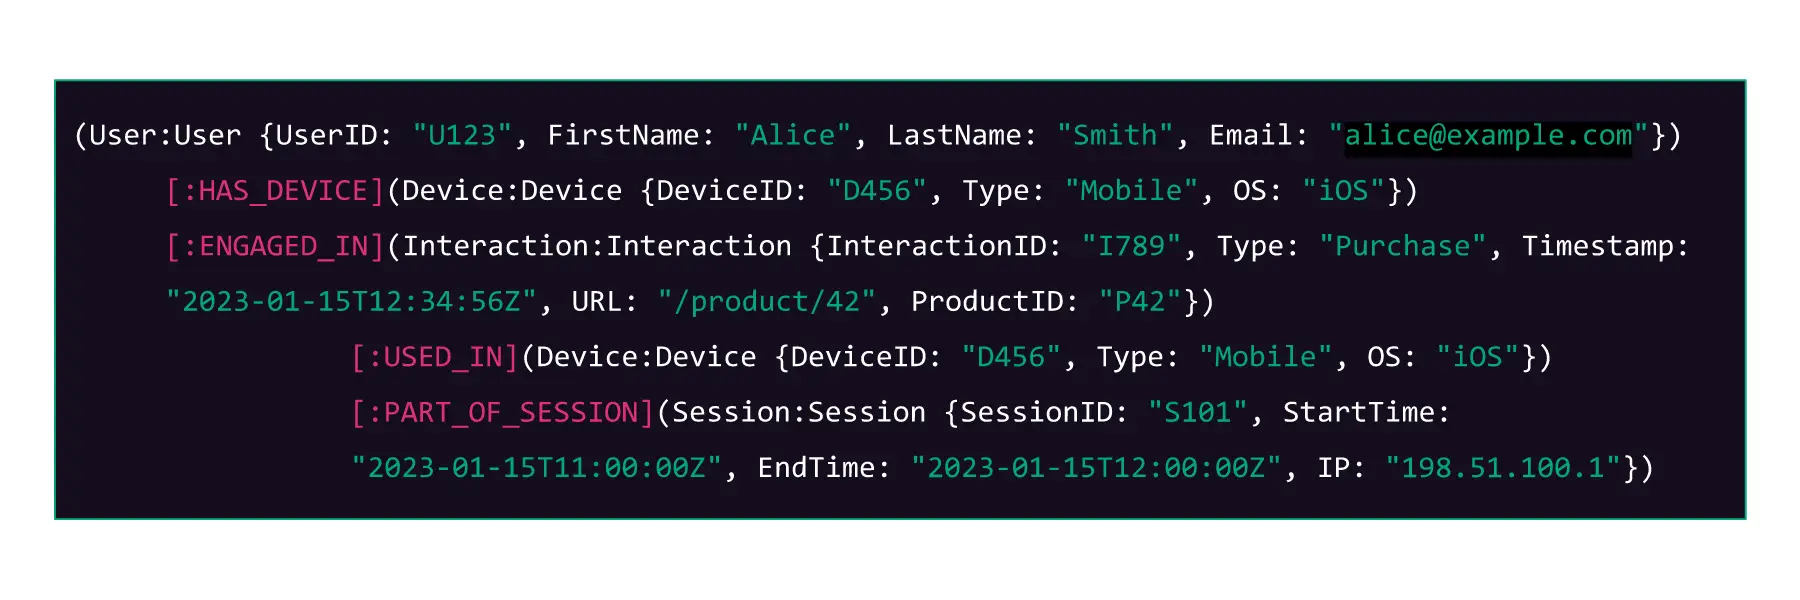
Figure K – Example graph database schema code snippet
Here, each User node is:
- Connected to a Device node via a HAS_DEVICE relationship
- Connected to an Interaction node via an ENGAGED_IN relationship
And each Interaction node is:
- Connected to a Device node via a HAS_DEVICE relationship
- Connected to an Interaction node via an ENGAGED_IN relationship
In a graph database, these relationships allow for complex queries to be run efficiently. For example, you could quickly find all user interactions from a specific device, or all sessions during which a particular type of interaction occurred. The relationships make exploring connected data intuitive and are fundamental to the utility of graph databases.
We’ll now take that same schema code snippet and represent it visually (Figure L).
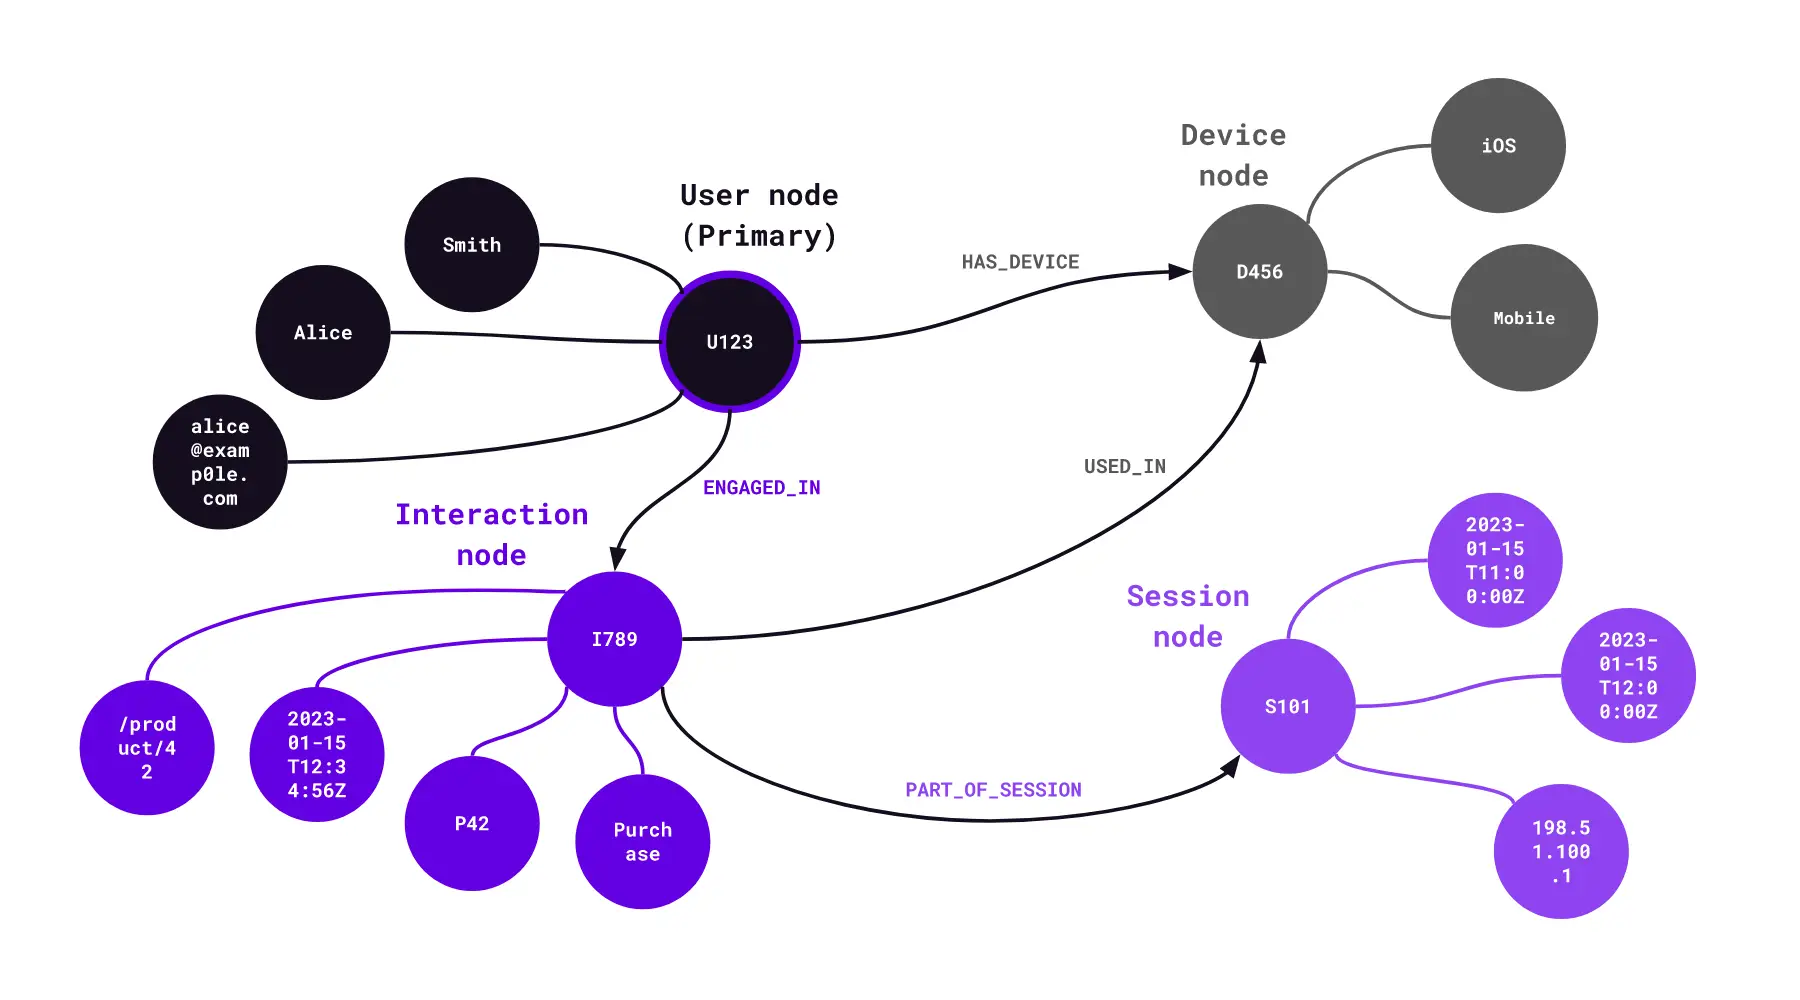
Figure L – Schema example visualisation
Walking through it step-by-step
- User node (userID, name, email) is connected to a Device node (deviceID, type, OS) via a HAS_DEVICE relationship.
- User node is also connected to an Interaction node via an ENGAGED_IN relationship, representing a user’s interaction, such as a click or a purchase.
- Interaction node is connected back to the Device node that it was USED_IN (there’s a relationship for that as well).
- Additionally, each Interaction is connected to a Session node via a PART_OF_SESSION relationship, which represents the session during which the interaction took place.
What defines an Identity Graph
An Identity Graph is defined by its ability to link identifiers to individual users, not the underlying technology.
While graph databases are increasingly becoming the preferred choice for identity graphs due to their efficiency in handling complex relationship, it’s important to remember that the defining characteristic of an identity graph is its ability to link identifiers to a single user, not the underlying technology. Even today, many organisations still deploy SQL or NoSQL databases for their identity graph implementations. Particularly those with existing legacy data systems or less complex identity resolution needs.
Thanks for reading and congratulations! You now know more about Identity Graphs than most people in the industry.
If you found this guide useful, check out our other blog posts or subscribe to our YouTube channel for more good stuff.
Last updated: 11 September, 2024